Live Monitor
td monitor is a real-time TUI dashboard for watching agent activity. Run it in a separate terminal to observe what your AI agent is doing as it works through tasks.
Starting the Monitor
td monitor
The monitor auto-refreshes as issues and logs change, giving you a live view of progress without interrupting the agent's workflow.
Views
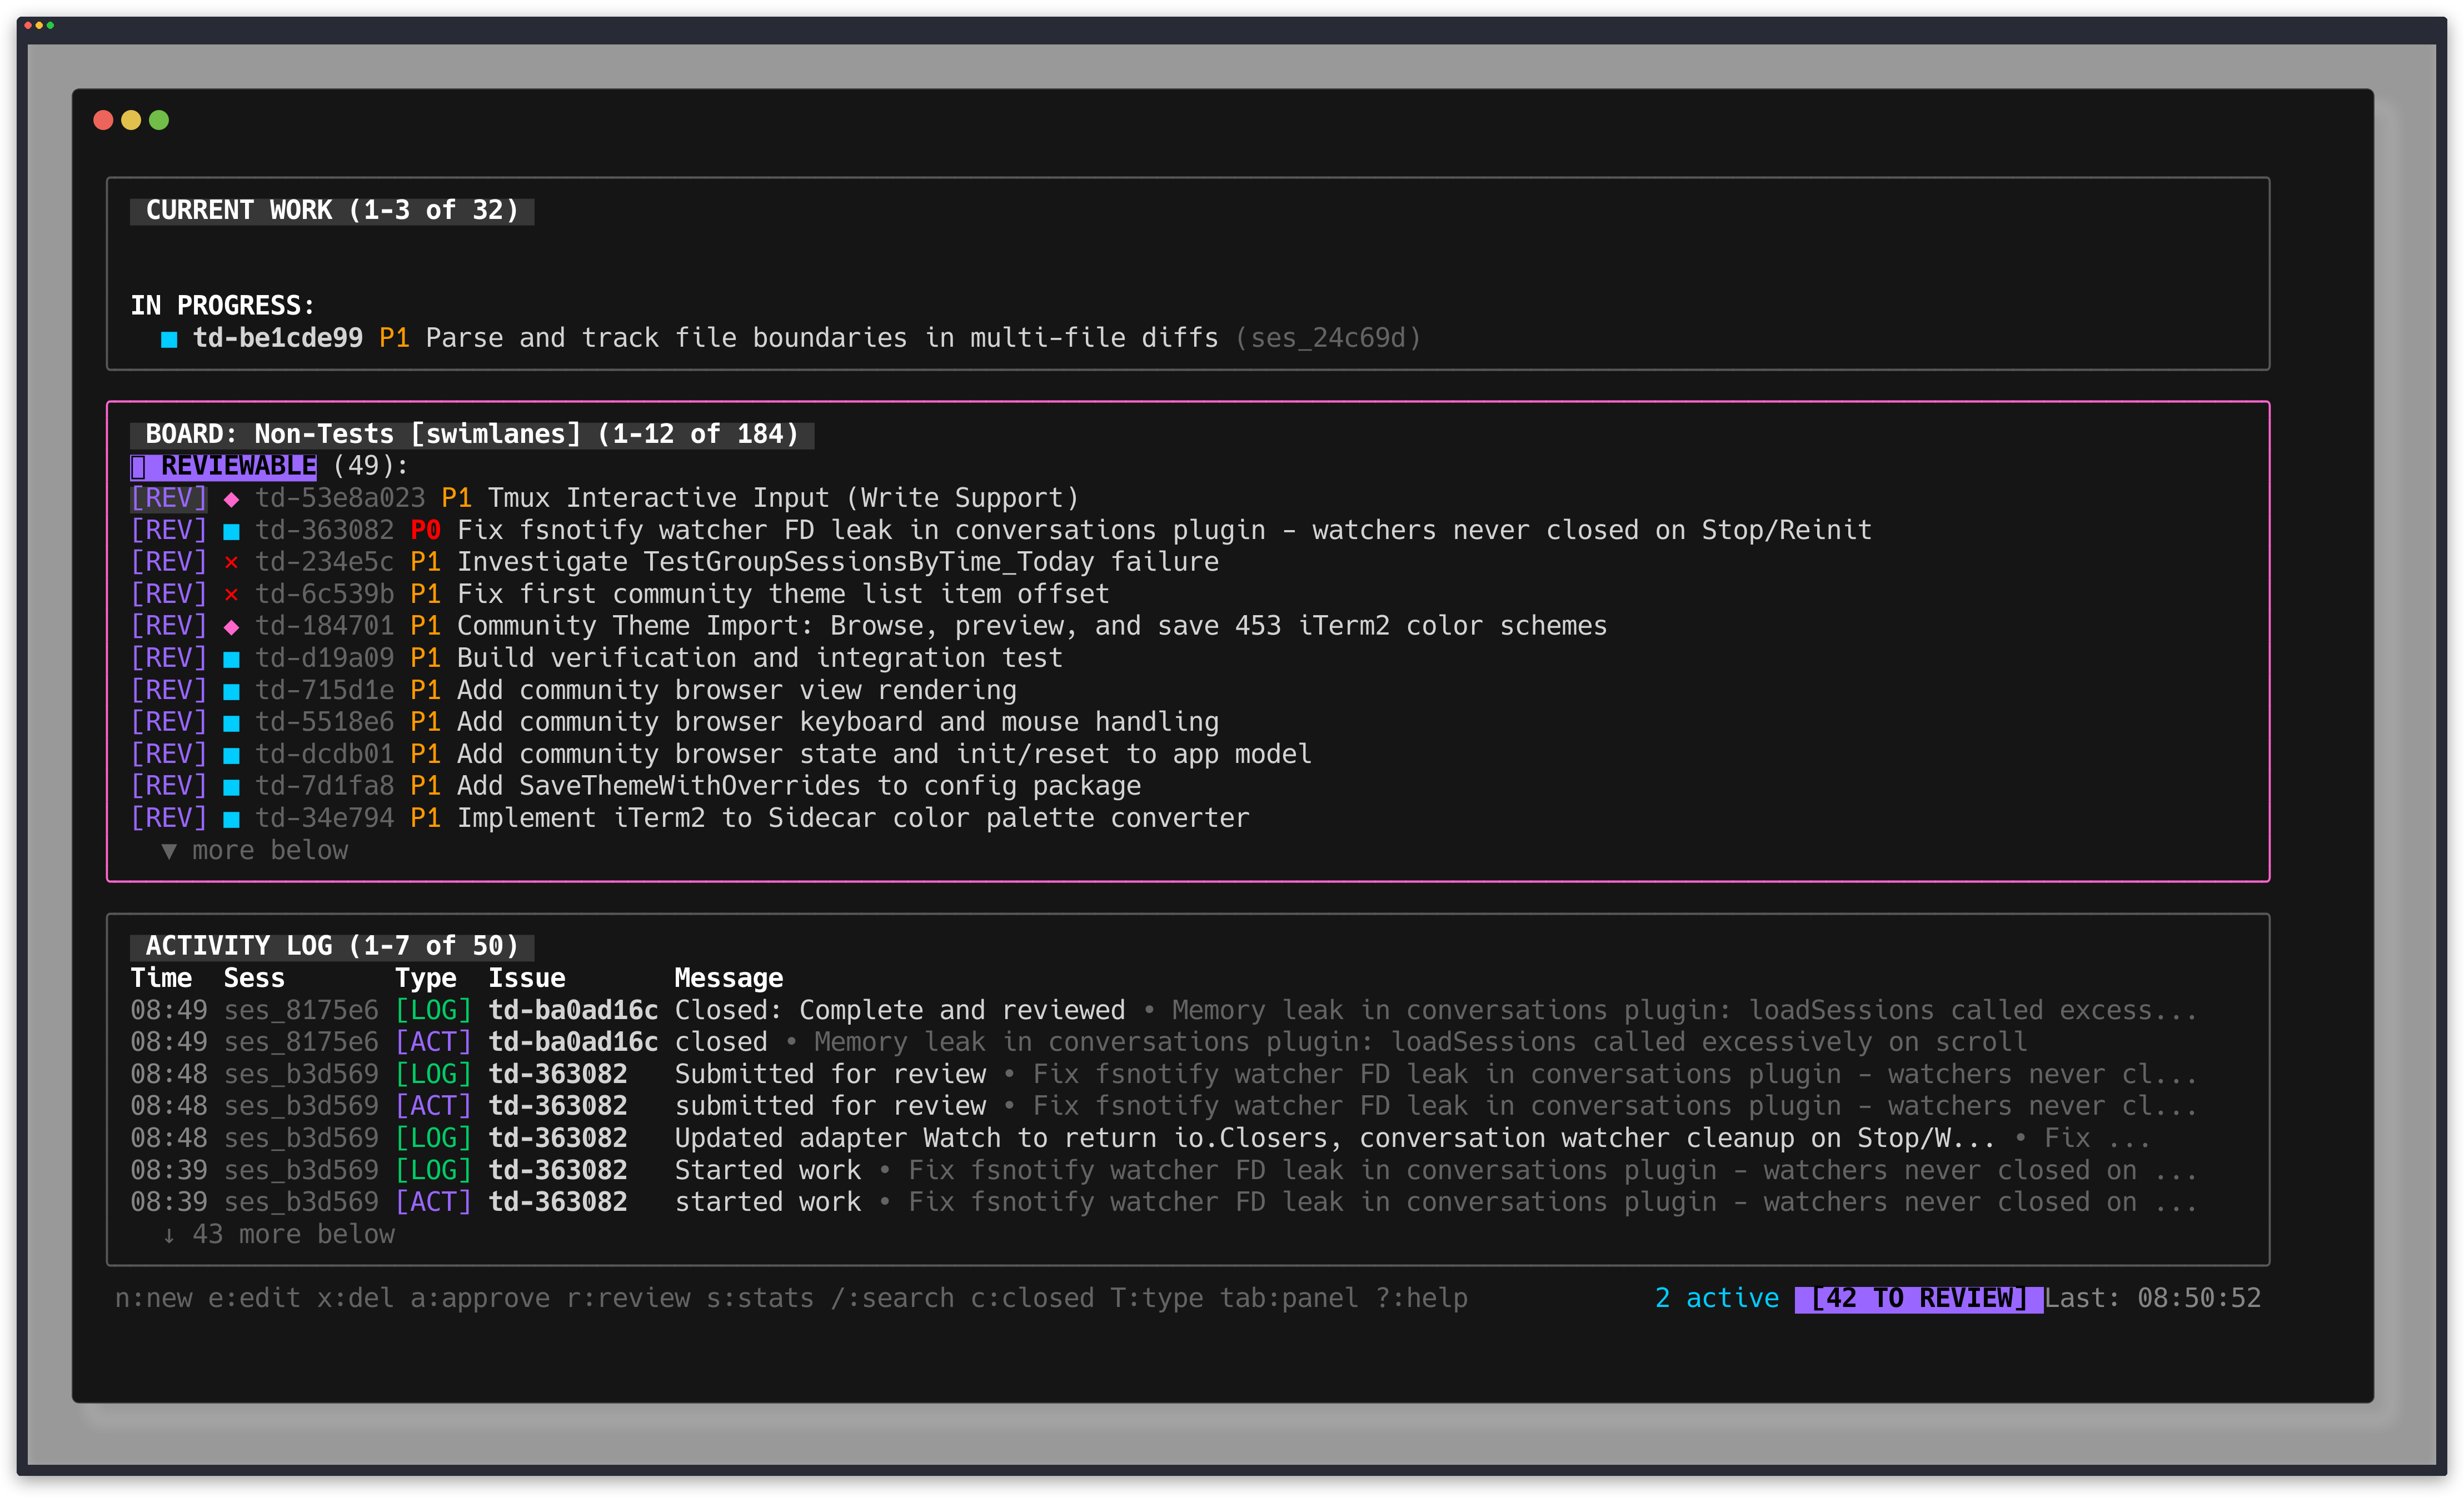
Default View
Shows three panels:
- Current focus - the issue actively being worked on
- Activity log - recent actions across all sessions
- Ready tasks - issues available to pick up next
Board View (press b)
Swimlanes organized by status:
- Open
- In Progress
- In Review
- Closed
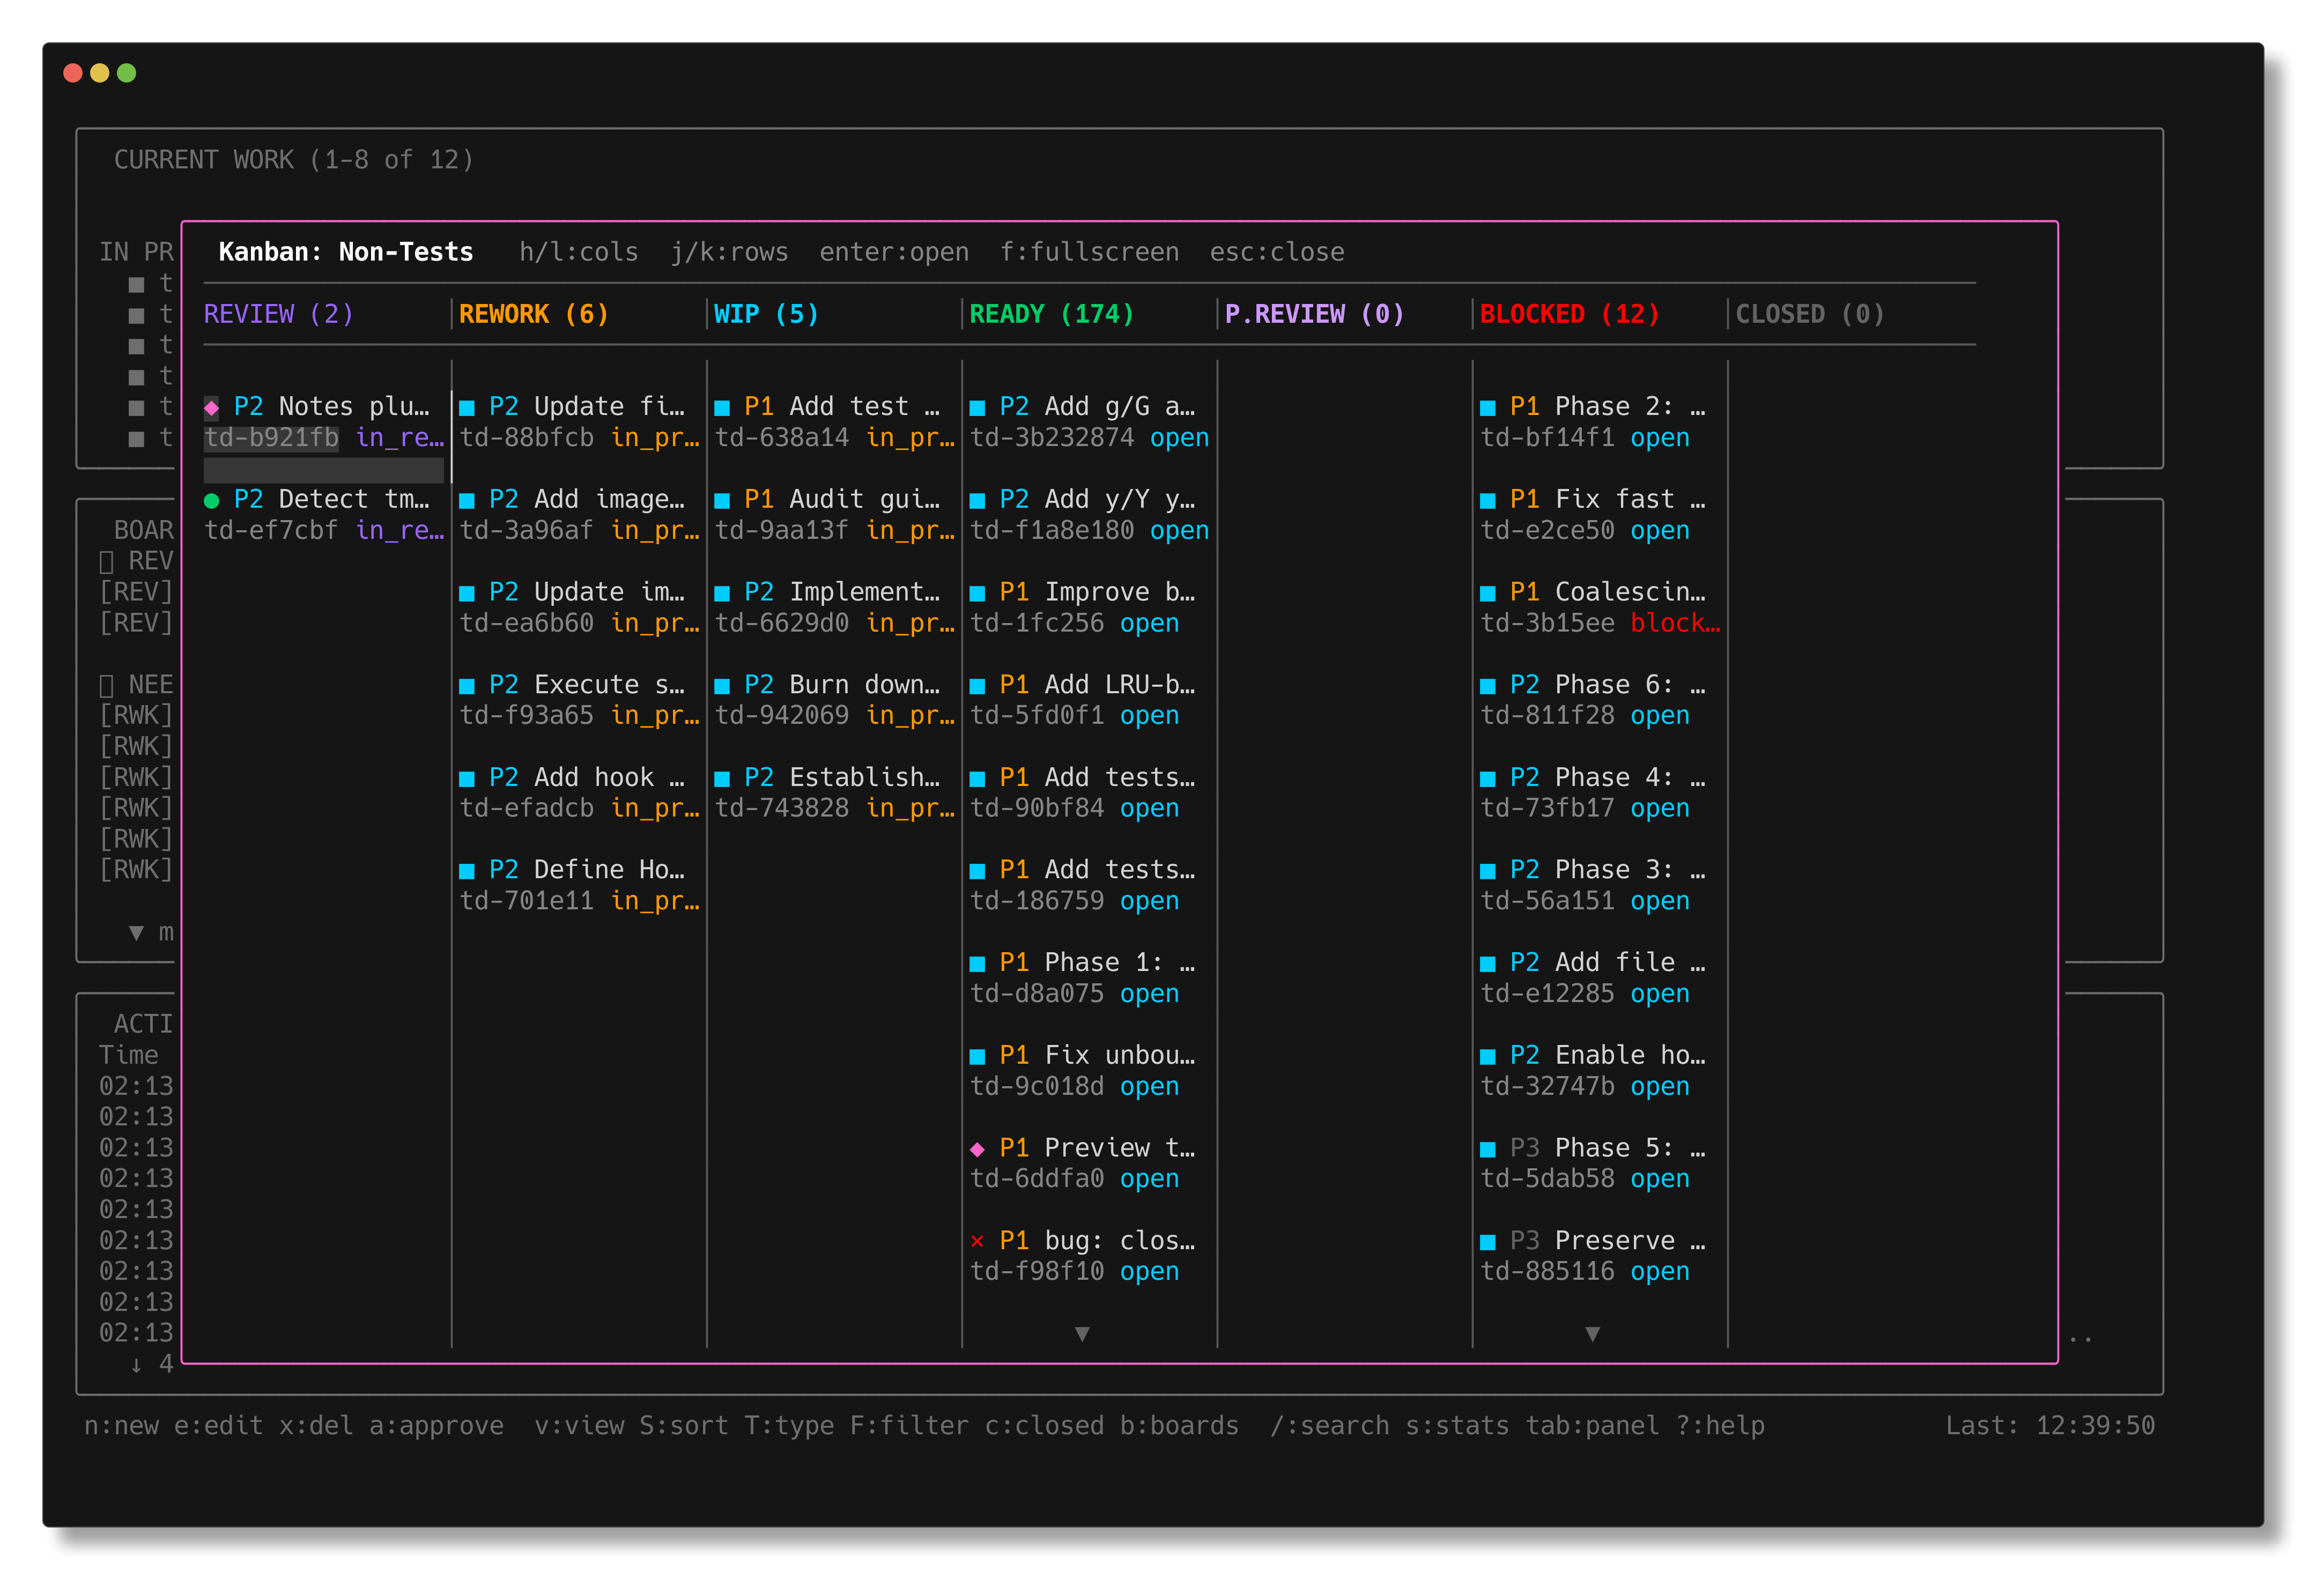
Kanban Board (press V)
A visual kanban overlay with tasks organized in columns by status. See the Kanban Board docs for full details.
Stats View (press s)
A statistics dashboard with project-wide metrics (see below).
Keyboard Shortcuts
| Key | Action |
|---|---|
b | Toggle board view |
s | Open stats modal |
/ | Search/filter issues |
c | Toggle closed tasks |
r | Refresh |
V | Open kanban board (in board view) |
j/k | Navigate up/down |
Enter | View issue details |
Esc | Close modal/exit search |
q | Quit |
Stats Dashboard
Press s to open the stats modal. It displays:
- Status breakdown - bar chart of issues by status
- By type and priority - distribution of work categories
- Summary metrics - total issues, points, completion rate
- Timeline data - oldest open issue, last closed issue
- Activity stats - log count, handoffs, most active session
Task Detail Modal
Press Enter on any issue to open its detail modal. This shows full issue information including:
- Title, status, type, priority
- Implementer and reviewer sessions
- Deferred until — with relative context (e.g., "in 7 days"), if set
- Due date — with warning styling for due-soon items and error styling for overdue
- Defer count — how many times the task has been re-deferred (shown when > 0)
- Description, logs, and handoff history
Search and Filter
Press / to activate search. Type to filter issues by name or description in real-time. Useful for navigating large projects quickly. Press Esc to clear the search and return to the full list.
Use Cases
- Watch agent progress in real-time from a second terminal
- Identify blocked or stale issues that need attention
- Review board status across all active work
- Track completion rate and velocity via the stats dashboard